What the U.S. Foreclosure Map Can Tell You About the Housing Market
The word foreclosure tends to spark anxiety—but it also serves as a critical signal for buyers, sellers, investors, and analysts alike. Whether you're planning your next move in real estate or simply keeping an eye on the market, understanding foreclosure patterns across the U.S. can help you make more informed decisions.
Let’s explore how the foreclosure map works, why it matters, and how you can use it to your advantage.
Foreclosure 101: What It Really Means
What Triggers a Foreclosure?
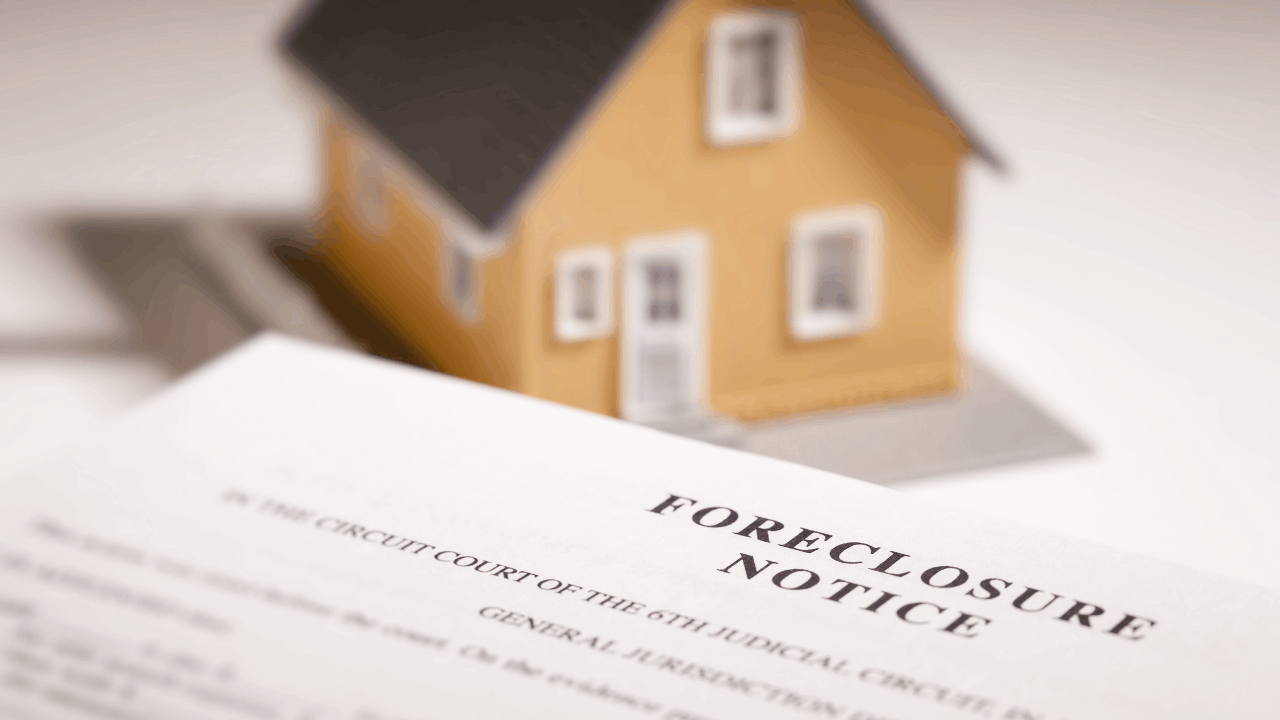
Foreclosure kicks in when a homeowner can’t keep up with their mortgage payments. The lender takes legal action to recover the unpaid loan—usually by repossessing and selling the home.
Two Main Types
-
Judicial Foreclosures: Involve court approval and are common in states like New York and Florida.
-
Non-Judicial Foreclosures: Quicker and cheaper, these occur outside of court in states like Texas and California.
Why You Should Pay Attention to Foreclosure Data

A Window Into Economic Conditions
High foreclosure rates often reflect broader financial issues—such as rising unemployment, inflation, or tighter lending standards.
The Ripple Effect on Communities
Vacant, bank-owned properties can drag down neighborhood property values, increase crime risk, and put pressure on local infrastructure.
How the Foreclosure Map Is Made
Where the Data Comes From
Most maps pull from a blend of:
-
County and state records
-
National databases like RealtyTrac and ATTOM
-
Public mortgage filings and notices
The result? A heatmap showing which areas are seeing the highest rates of distressed property sales.
Interpreting the Colors
-
Red zones signal elevated foreclosure activity.
-
Green zones reflect low or stable housing conditions.
2025 Foreclosure Trends: What’s the Current Landscape?

States With Elevated Activity
These five states currently top the charts in terms of foreclosure rates:
-
Illinois – High urban foreclosure rates, especially around Chicago.
-
New Jersey – A slow judicial process keeps numbers elevated.
-
Delaware – Faces affordability issues and limited housing supply.
-
South Carolina – A tourism-heavy economy with patchy local job markets.
-
Florida – Still clearing older cases while dealing with affordability gaps.
Low-Foreclosure States
States with fewer distressed properties in 2025 include:
-
North Dakota
-
South Dakota
-
Vermont
-
Montana
These areas tend to have smaller populations and more stable employment sectors.
Suburban and Rural Trouble Spots
More Than Just Big Cities
Foreclosure surges aren’t limited to metro areas. Rural counties and outlying suburbs are experiencing increased pressure—especially where housing costs have risen faster than wages.
Employment Volatility
Layoffs or inflation spikes in localized economies can create mini-crises, pushing once-stable regions into high-risk zones.
Using Foreclosure Maps to Make Smart Moves

For Buyers: Finding Deals (With Caution)
Homes in foreclosure often come at a discount, but repairs and legal complexities can add up fast. The map helps you pinpoint areas worth exploring—but due diligence is non-negotiable.
For Sellers: Watch Your Local Market
Rising foreclosure rates in your area may signal softer demand and falling home values. If you're planning to list soon, consider adjusting your pricing or marketing strategy.
Tools for Exploring Foreclosure Listings
Looking to explore listings in high-foreclosure areas? Start with:
-
Foreclosure.com
-
Zillow’s Foreclosure Section
-
County Assessor & Clerk Websites
These tools allow filtering by foreclosure status, price range, and neighborhood.
When to Bring in the Pros
Foreclosure deals can be complex. Team up with a real estate agent who has experience in distressed properties, and consult a legal expert if necessary.
Avoiding Foreclosure: Key Prevention Tips

Know Your Mortgage Terms
Understand exactly what your loan involves—especially if it's adjustable-rate or has balloon payments. Surprises can be expensive.
Don’t Wait to Contact Your Lender
If you’re struggling financially, reach out immediately. Lenders may offer temporary relief through forbearance, payment plans, or refinancing.
Government Assistance Programs
Explore options like:
-
FHA loss mitigation tools
-
HAMP or similar loan modification programs
These can help reduce your monthly payments and avoid foreclosure altogether.
The Bottom Line: Why the Foreclosure Map Matters
Foreclosure maps aren’t just real estate tools—they’re market indicators that reflect the financial pulse of the country. Whether you're buying, selling, or investing, tracking these trends helps you stay informed and make smarter moves.
Think of the red zones as caution lights—and potential opportunities. Use this data to navigate the market, not fear it.
FAQs
1. How current is foreclosure map data?
Most sources update monthly, though some offer weekly refreshes for high-activity zones.
2. Can I buy a property directly from a foreclosure map?
No, but the map can guide your search toward areas with higher volumes of bank-owned or distressed homes.
3. Are foreclosures always cheaper?
Often they are—by 10–30%—but buyers must account for repairs, delays, and legal complexity.
4. Is investing in a foreclosure-heavy area risky?
It can be. High rates may mean bargains, but they may also reflect unstable local economies. Evaluate carefully.
5. Can foreclosure be stopped once it begins?
Yes. The earlier you act, the more options you have. Open communication with your lender and use of relief programs can often stop the process.
Categories
Recent Posts


7997 W. Sahara Ave. Suite 101, Vegas, NV, 89117, United States
